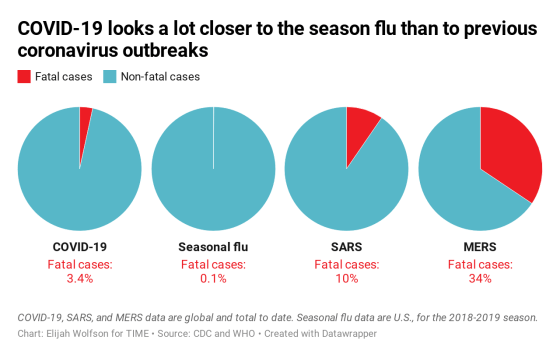
Nobody had ever seen the coronavirus that causes the disease known as COVID-19 before the current outbreak began in China in December 2019. So for context, it is often compared to a symptomatically similar disease we know well: the seasonal flu, which infects many people each year but kills only about 0.1% of them on average.
Many people were alarmed, then, when the World Health Organization announced in March that COVID-19 has killed 3.4% of the people who have caught it so far—a mortality rate far higher than not only the seasonal flu, but also higher than earlier COVID-19 mortality estimates, which were around 2%.
That estimate may say more about the inherent uncertainty in making these sorts of calculations during an evolving outbreak than it does about the true deadliness of COVID-19.
Since the COVID-19 outbreak began to pick up steam in China in January, experts have been scrambling to get a handle on the disease and the way it behaves. But they have also warned that estimates are not exact, and that numbers are likely to shift over time. One key reason: people with milder versions of the illness are underrepresented in official case counts, since they may not be sick enough to seek medical attention or realize they have anything more than a cold. Some people, research now suggests, may get infected by SARS-CoV-2, the virus that causes COVID-19, without showing any symptoms at all.
That means the total number of reported cases is very likely an underestimate—and by not counting many mild or asymptomatic cases, we’re likely overestimating the disease’s overall mortality rate. President Donald Trump, for one, told Fox News he has a “hunch” that the actual mortality rate is likely below 1%.
Looking at data from countries with robust testing systems does support the idea that the disease’s mortality rate may be lower than 3.4%. Countries that have tested significant numbers of people are generally reporting lower mortality rates than those, like the U.S., that have tested in far lower numbers and with a stronger focus on severe cases. This suggests that when testing networks are broadened to catch people with less serious illnesses, and case counts then reflect this range of severity, mortality rates go down.
The mortality rate in South Korea, where more than 1,100 tests have been administered per million residents, comes out to just 0.6%, for example. In the U.S., where only seven tests have been administered per million residents, the mortality rate is above 5%.
The chart below is a snapshot of testing and mortality rates on March 5, obtained through records published by, or direct contact with, each country’s department of health. The quality of the data per country range from extremely precise, such as in South Korea and the U.K. to fairly rough, as with Australia, whose department of health offered a rounded number. As for the U.S., the Centers for Disease Control and Prevention told TIME that 1,526 people had been tested as of March 4, but said this number “did not include testing being done at state and local public health laboratories.” We’ve chosen to use the figure of 1,895 that The Atlantic reported on March 6, which includes both the CDC count, and additional testing numbers their reporters discovered through contacting the local health departments of all 50 states and D.C.
( function() {
var func = function() {
var iframe = document.getElementById(‘wpcom-iframe-6d1d9617c824a40aea63a95e36b61178’)
if ( iframe ) {
iframe.onload = function() {
iframe.contentWindow.postMessage( {
‘msg_type’: ‘poll_size’,
‘frame_id’: ‘wpcom-iframe-6d1d9617c824a40aea63a95e36b61178’
}, “https:\/\/embeds.time.com” );
}
}
// Autosize iframe
var funcSizeResponse = function( e ) {
var origin = document.createElement( ‘a’ );
origin.href = e.origin;
// Verify message origin
if ( ’embeds.time.com’ !== origin.host )
return;
// Verify message is in a format we expect
if ( ‘object’ !== typeof e.data || undefined === e.data.msg_type )
return;
switch ( e.data.msg_type ) {
case ‘poll_size:response’:
var iframe = document.getElementById( e.data._request.frame_id );
if ( iframe && ” === iframe.width )
iframe.width = ‘100%’;
if ( iframe && ” === iframe.height )
iframe.height = parseInt( e.data.height );
return;
default:
return;
}
}
if ( ‘function’ === typeof window.addEventListener ) {
window.addEventListener( ‘message’, funcSizeResponse, false );
} else if ( ‘function’ === typeof window.attachEvent ) {
window.attachEvent( ‘onmessage’, funcSizeResponse );
}
}
if (document.readyState === ‘complete’) { func.apply(); /* compat for infinite scroll */ }
else if ( document.addEventListener ) { document.addEventListener( ‘DOMContentLoaded’, func, false ); }
else if ( document.attachEvent ) { document.attachEvent( ‘onreadystatechange’, func ); }
} )();
Few countries with significant testing capacity are reporting mortality rates above 2%, but Italy has proven an outlier. Even with 638 tests given per million people, the country is still reporting a mortality rate of nearly 4%. While the exact reason for the discrepancy is unclear, it could point to differences in the country’s testing strategy, the specific test it is using or something unique about the actual outbreak there.
Even when taking the current estimated global mortality rate of 3.4% at face value, COVID-19 looks more like influenza than other once-novel coronaviruses. Severe Acute Respiratory Syndrome (SARS) killed about 10% of the people who got it, while Middle East Respiratory Syndrome (MERS) was even deadlier, killing 34% of patients. At least so far, COVID-19 does seem to be more lethal than the seasonal flu, but it’s closer to that end of the spectrum.

A more complete—and, hopefully, less severe—picture of COVID-19 will likely emerge as the outbreak continues, testing capacity increases and data are refined. Until then, stay calm and keep washing your hands.
Additional reporting by Alice Park.
Sign up for our daily coronavirus newsletter by clicking on this link,
